April 2025
Summary
April 2025 tested global markets in ways that have not been felt since March of 2020. The stress kicked off on April 2 (Liberation Day) with President Trump’s global tariff announcement. His stated plan was to tax imports from every country in the world at a minimum of 10%, with some trading partners facing rates approaching 50%.
The market reaction was swift and severe as stocks nosedived in tandem with the dollar. After an initial flight to Treasuries, the U.S. bond market sold off, with the 10-year Treasury rising from a yield just under 4% to nearly 4.5% in less than a week of trading. Global investors paused to question the safety of U.S. debt and the dollar more broadly. Subsequent delays and adjustments in tariff implementation were met with relief rallies, which enabled risky assets to recoup most of the losses by the close of the month. In the end, U.S. stocks still finished lower in April, underperforming international equities for a fourth consecutive month, while high quality bonds ended modestly higher with elevated volatility.
Equities
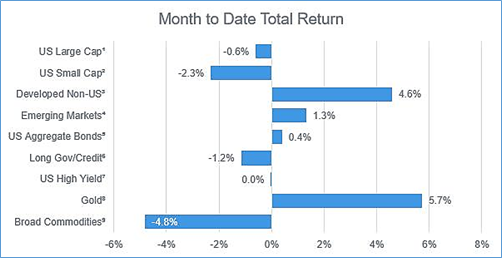
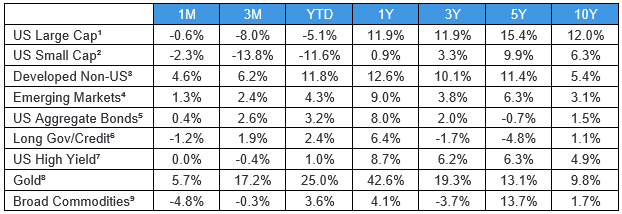
U.S. stocks continued their slide in the wake of President Trump’s tariff announcement. Major U.S. indexes declined 10-12% in the five trading days after April 2, before snapping back on subsequent news of a 90-day pause on tariff implementation. Large cap stocks ultimately finished 0.6% lower on the month as the market continued its tumble from lofty highs, marking the fourth negative month out of the last five. Small caps were battered once again and have lost nearly 19% after a post-election pop last November.
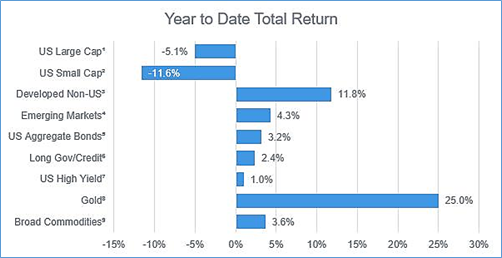
Outside of the U.S., investors fared better, as developed international equities continued to widen their outperformance year-to-date, returning 4.6% in April. The MSCI EAFE Index has managed to outpace U.S. markets by nearly 17% thus far in 2025. Emerging market stocks ended the month relatively unscathed, finishing 1.3% higher. EM returns have been positive in each of the first four months of 2025.
Fixed Income
Bonds took an interesting journey through the course of April as well. Treasury yields traded in a wide range with the 10-year Treasury note varying between 4 and 4.5% during the month. Broad concerns over the reaction to the U.S. as a safe haven for assets in the wake of the Liberation Day stock selloff. The selloff also permeated fixed income markets for most of the month, as global allocators seemed to question the protection offered by U.S. debt, and the U.S. dollar. Corporate credit spreads widened off of low levels, wiping out the month’s income gains for below investment grade assets. Trading on high-grade debt settled a bit as the month progressed, but bond investors remained on edge entering the month of May.
1 – Russell 1000, 2 – Russell 2000, 3 – MSCI EAFE, 4 – MSCI Emerging Markets, 5 – Bloomberg US Agg, 6 – Bloomberg US Long Gov/Credit
7 – Bloomberg US Corporate High Yield, 8 – Bloomberg Gold Subindex, 9 – Bloomberg Commodity
Highland Consulting Associates, Inc. is a registered investment adviser. Information presented is for educational purposes only and does not intend to make an offer of solicitation for the sale or purchase of specific securities, investments, or investment strategies. Investments involve risk and unless otherwise stated, are not guaranteed. Be sure to first consult with a qualified financial adviser and/or tax professional before implementing any strategy discussed herein. Past performance is not indicative of future performance.
Disclosure Statements
Source: Bloomberg Index Services Limited. BLOOMBERG® is a trademark and service mark of Bloomberg Finance L.P. and its affiliates (collectively “Bloomberg”). Bloomberg or Bloomberg’s licensors own all proprietary rights in the Bloomberg Indices. Bloomberg does not approve or endorse this material or guarantee the accuracy or completeness of any information herein, nor does Bloomberg make any warranty, express or implied, as to the results to be obtained therefrom, and, to the maximum extent allowed by law, Bloomberg shall not have any liability or responsibility for injury or damages arising in connection therewith.
Source: London Stock Exchange Group plc and its group undertakings (collectively, the “ LSE Group” ). © LSE Group [year]. FTSE Russell is a trading name of certain of the LSE Group companies. “ FTSE®” “ Russell®” , “ FTSE Russell®” are trade mark(s) of the relevant LSE Group companies and are used by any other LSE Group company under license. “ TMX®” is a trade mark of TSX, Inc. and used by the LSE Group under license. All rights in the FTSE Russell indexes or data vest in the relevant LSE Group company which owns the index or the data. Neither LSE Group nor its licensors accept any liability for any errors or omissions in the indexes or data and no party may rely on any indexes or data contained in this communication. No further distribution of data from the LSE Group is permitted without the relevant LSE Group company’s express written consent. The LSE Group does not promote, sponsor or endorse the content of this communication.
Copyright MSCI 2017. Unpublished. All Rights Reserved. This information may only be used for your Internal use, may not be reproduced or redisseminated in any form and may not be used to create any financial instruments or products or any indices. This information is provided on an "as is" basis and the users of this information assumes the entire risk of any use it may make or permit to be made of this information. Neither MSCI, any of its affiliates or any other person involved in or related to compiling, computing or creating this information makes any express or implied warranties or representations with respect to such information, or the results to be obtained by the use thereof, and MSCI, its affiliates and each such other person hereby expressly disclaim all warranties (including, without limitation, all warranties of originality, accuracy, completeness, timeliness, non- infringement, merchantability and fitness for a particular purpose) with respect to this information. Without limiting any of the foregoing, in no event shall MCSI, any of its affiliates or any other person involved in or related to compiling, computing or creating this information have any liability for any direct, indirect, special, incidental, punitive, consequential or any other damages. The MSCI information is the exclusive property of Morgan Stanley Capital International ("MSCI") and many not be reproduced or redisseminated in any form or used to create any financial products or indices without MSCI's express prior written permission. The information is provided "as is" without any express or implied warranties. In no event shall MSCI or any of its affiliates or information providers have any liability of any kind to any persons or entity arising from or related to this information.