December 2025
Summary
Domestic stocks faded into the year-end holiday, finishing mostly flat for the month of December, while interest rates edged higher. The Federal Reserve pushed through one final rate cut for 2025, as U.S. markets wrapped the year on a tumultuous note. International stocks finished strong, with both developed and emerging markets gaining 3% for the month. Ex-U.S. equities ended 2025 with gains in excess of 30%, outperforming U.S. stocks for the first time in eight years.
Equities
U.S. stocks traded sideways in December before fading into year-end. Large caps managed to end flat while smaller companies traded lower, declining by 0.6% for the month. Meanwhile, non-U.S. stocks finished with a flourish, gaining 3% in December. Emerging markets took home the title of top performing equity market for 2025, with a total return of 33.6%, while developed international stocks were a close second, booking a gain of 31.2% for the year.
Fixed Income
Interest rates moved higher in December, leading to losses for bonds. The yield on the US 10-year treasury rose 15 basis points month-over-month, offsetting income gains and giving core bonds a red month to finish the year. Credit held up as spreads ground tighter and short duration bonds got a boost from a Fed rate cut, and a steepening yield curve. For the full year, investment grade bonds provided a solid 7.3% return while high yield bonds gained 8.6%.

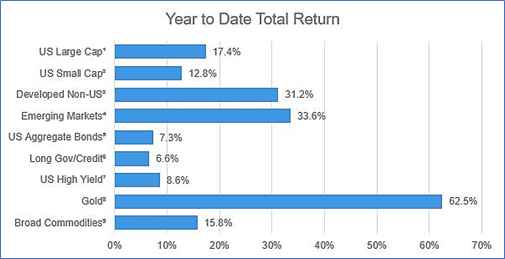
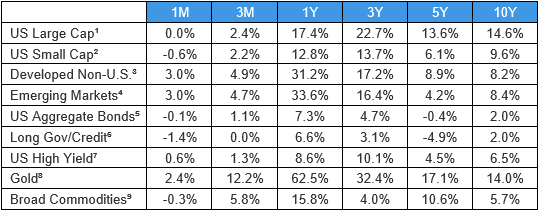
1 – Russell 1000, 2 – Russell 2000, 3 – MSCI EAFE, 4 – MSCI Emerging Markets, 5 – Bloomberg US Agg, 6 – Bloomberg US Long Gov/Credit
7 – Bloomberg US Corporate High Yield, 8 – Bloomberg Gold Subindex, 9 – Bloomberg Commodity
Highland Consulting Associates, Inc. is a registered investment adviser. Information presented is for educational purposes only and does not intend to make an offer of solicitation for the sale or purchase of specific securities, investments, or investment strategies. Investments involve risk and unless otherwise stated, are not guaranteed. Be sure to first consult with a qualified financial adviser and/or tax professional before implementing any strategy discussed herein. Past performance is not indicative of future performance.
Disclosure Statements
Source: Bloomberg Index Services Limited. BLOOMBERG® is a trademark and service mark of Bloomberg Finance L.P. and its affiliates (collectively “Bloomberg”). Bloomberg or Bloomberg’s licensors own all proprietary rights in the Bloomberg Indices. Bloomberg does not approve or endorse this material or guarantee the accuracy or completeness of any information herein, nor does Bloomberg make any warranty, express or implied, as to the results to be obtained therefrom, and, to the maximum extent allowed by law, Bloomberg shall not have any liability or responsibility for injury or damages arising in connection therewith.
Source: London Stock Exchange Group plc and its group undertakings (collectively, the “ LSE Group” ). © LSE Group [year]. FTSE Russell is a trading name of certain of the LSE Group companies. “ FTSE®” “ Russell®” , “ FTSE Russell®” are trade mark(s) of the relevant LSE Group companies and are used by any other LSE Group company under license. “ TMX®” is a trade mark of TSX, Inc. and used by the LSE Group under license. All rights in the FTSE Russell indexes or data vest in the relevant LSE Group company which owns the index or the data. Neither LSE Group nor its licensors accept any liability for any errors or omissions in the indexes or data and no party may rely on any indexes or data contained in this communication. No further distribution of data from the LSE Group is permitted without the relevant LSE Group company’s express written consent. The LSE Group does not promote, sponsor or endorse the content of this communication.
Copyright MSCI 2017. Unpublished. All Rights Reserved. This information may only be used for your Internal use, may not be reproduced or redisseminated in any form and may not be used to create any financial instruments or products or any indices. This information is provided on an "as is" basis and the users of this information assumes the entire risk of any use it may make or permit to be made of this information. Neither MSCI, any of its affiliates or any other person involved in or related to compiling, computing or creating this information makes any express or implied warranties or representations with respect to such information, or the results to be obtained by the use thereof, and MSCI, its affiliates and each such other person hereby expressly disclaim all warranties (including, without limitation, all warranties of originality, accuracy, completeness, timeliness, non- infringement, merchantability and fitness for a particular purpose) with respect to this information. Without limiting any of the foregoing, in no event shall MCSI, any of its affiliates or any other person involved in or related to compiling, computing or creating this information have any liability for any direct, indirect, special, incidental, punitive, consequential or any other damages. The MSCI information is the exclusive property of Morgan Stanley Capital International ("MSCI") and many not be reproduced or redisseminated in any form or used to create any financial products or indices without MSCI's express prior written permission. The information is provided "as is" without any express or implied warranties. In no event shall MSCI or any of its affiliates or information providers have any liability of any kind to any persons or entity arising from or related to this information.