There’s No Time like the Present, and other lessons on…

Defined Benefit Funding Levels, Contribution Relief, and Unintended Consequences
At the close of 2012, pension funding levels for a broad set of defined benefit plans sat in the high-seventies. Sponsors had weathered the massive equity losses of the 2008 global financial crisis (GFC), and subsequent plummeting interest rates, and they seemed poised to recoup their losses. The markets would be kind to investors over the next half-decade with the S&P 500 nearly doubling in price, generating a cumulative total return in excess of 100%, and outpacing long duration fixed income (a proxy for pension liabilities) substantially.
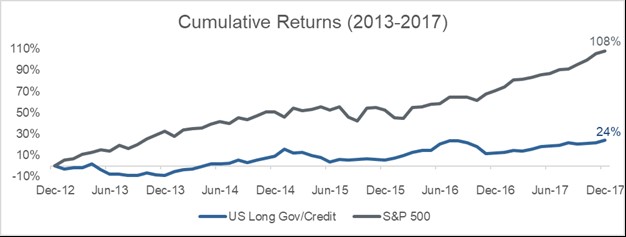
Figure 1
So how did sponsors fare? Not as well as one might expect, given the data above.
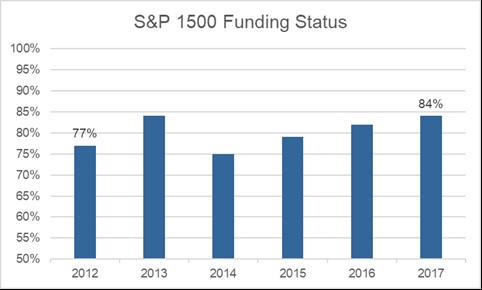
Figure 2: Source – Mercer
First, let’s establish that pension plan assets are generally allocated to some mix of equities and fixed income, most often, longer duration.
Some sponsors allocate to hedge funds or other alternatives, but the primary portfolio mix will be heavily dedicated to the two aforementioned asset classes. Were sponsors over-allocated to credit in the wake of the GFC? Examining the income statements of S&P 500 companies with DB plans, we don’t find a conservative approach to equity investing.
Of 265 companies with complete data available, the median equity allocation ranged from 40-46% from 2012 to 2017, with 60-75% allocating over 1/3 of their portfolio to equities – a mix that would still produce large investment gains relative to a typical pension liability.
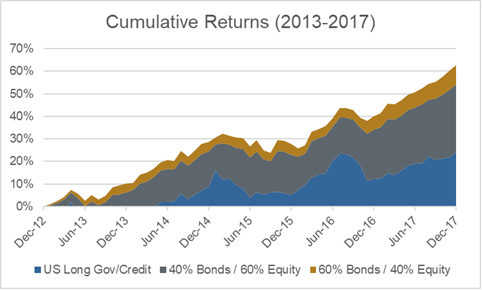
Figure 3
No, investor (mis)behavior would not explain the inability to capitalize on a strong market environment. First, a brief detour into pension math.
Both pension assets and liabilities are dynamic, affected by a handful of factors from year to year. Liabilities will grow with service cost (benefit accruals for open plans) and interest cost (the impact of the passage of time on future cash flows – the mechanism which makes long duration credit an effective proxy). Changes in the discount rate (driven by market interest rates) will also produce gains or losses for the liability.
Assets grow at the rate of portfolio returns, are depleted by ongoing benefit payments, and replenished by sponsor contributions. Various accounting and actuarial adjustments will also affect the picture on the margin. If we inspect the measurable factors impacting assets and liabilities, as reflected by the median values reported on plan income statements, we can identify the culprit.
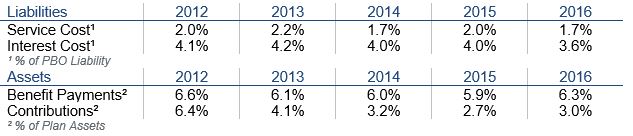
Service cost, interest cost, and benefit payments have been fairly stable, but sponsor contributions have declined notably from 2012 levels.
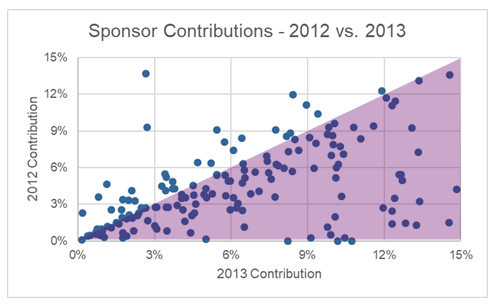
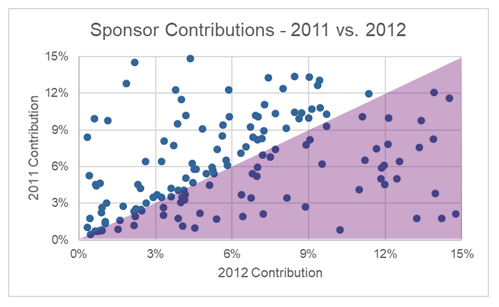
Figure 4: Data points in the shaded area represent sponsors contributing less to the DB plan relative to the prior year
In 2012, the Moving Ahead for Progress in the 21st Century Act (MAP-21) was signed into law. Included in the legislation was a change in the method for calculating the annual minimum required contribution (MRC) for defined benefit plans. Prior to MAP-21, the discount rate used in calculating the MRC was a blended rate based on market interest rates over the prior 24 months.
With corporations struggling to emerge from the (GFC), the legislation was designed to offer temporary contribution relief to sponsors so that they would plow more (taxable) money into operations in lieu of (tax-exempt) pension contributions.
Congress incentivized investment in business operations over pension contributions which was meant to stimulate the economy and boost tax revenues at the same time. The relief was to be effectively phased out by 2016 initially—but by 2015 the timeline had been extended twice, and will now be in force until 2023.
In aggregate, sponsors have embraced contribution relief, and the ramifications for pension plan funding have been decidedly negative. Each dollar paid out to a plan participant is a full dollar removed from plan assets, but due to the actuarial nature of pension liability calculations, only pennies come off the pension obligation. Net of interest cost, the impact may be entirely negligible.
Contributions are necessary if for no other reason than to offset cash flowing out of plan assets to pay benefits. Looking at 2012, for example, 6.6% of plan assets were paid to participants, and 6.4% of assets flowed back into the plan in the form of contributions, making the net effect nearly cash flow neutral. Contrast that to 2016, where the net shortfall exceeded 3%, resulting in a burden shouldered by asset returns.
The implications of reduced sponsor contributions have shown themselves clearly in the form of lower funding gains during a strong investment environment. Had sponsors contributed at the rate of 6% of the liability (roughly the percentage paid out in benefit payments) they could very well have found themselves fully funded rather than hovering at a funding rate around 85%.
An illustration, using basic portfolio allocations, quantifies the improvement that could have resulted from higher contributions.
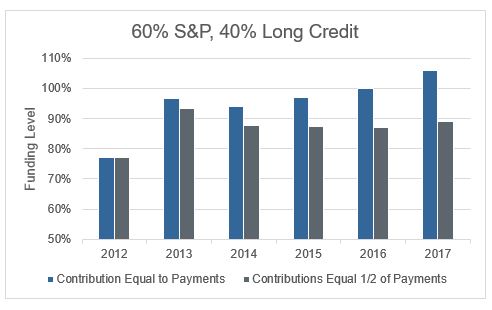
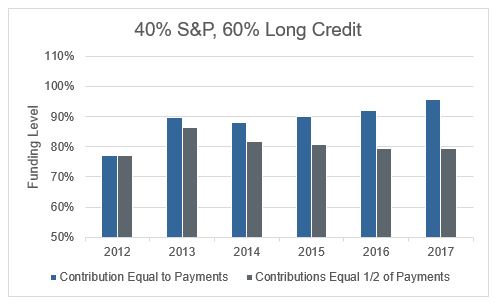
Figure 5: Plans contributing at the same level as benefit payments would have leveraged strong investment returns to improve funding levels beyond what sponsors exercising contribution relief realized.
This illustrates the critical role of sponsor contributions. Also, market volatility of the last few years seems unlikely to continue.
Recent tax reform legislature has further complicated the pension contribution case, reducing the value of the tax deduction sponsors will receive when funding up the plan. While this change has caused many sponsors to pull forward future contributions to the current year to maximize the deduction before changes go into effect, in the longer term these legislative changes will likely reduce the incentive for sponsors to contribute to pension plans. While time may be running out to lock in a larger tax deduction, the need for sponsor contributions isn’t going anywhere.
The market offers sponsors another temptation as well, in the form of rising interest rates, which should in turn flow through to higher discount rates, and lower liability estimates. While the Federal Reserve has charted a course for gradually higher interest rates, there are mechanisms in place to limit the benefits that plans can realize from rising rates. Many sponsors have become heavily allocated to long duration fixed income in their investment portfolios, and have significant interest rate exposure. From a minimum contribution standpoint, funding relief severed much of the sensitivity of liability discount rates to spot interest rates by incorporating long-term smoothing into discount rate calculations.
There may have been “no time like the present,” to improve your plan’s funded status, but we also believe “it’s never too late to do the right thing.” The new Tax Cuts and Job Act, with no direct impact on DB funding laws, may still give you reason to accelerate contributions that are allowable into 2018.
As independent investment advisers, Highland can give you an informed and unbiased point-of-view on the subject. Just send us a note or give us a call, and we can talk about the options available to you.