Forecasting Equity Returns – What Can I Count On in 2024? Part One: Normalized Distribution – Ring a Bell (Curve)?

Photo credit: Pixabay
A three-part conversation with Highland Consulting Associates.
In the next several weeks we’ll consider what you can expect from investment returns in 2024—or, rather, whether you can count on 2024 predictions at all. We’ll break this series into three parts to cover the major areas of investment opportunities beginning with historical returns, followed by components of market returns, and finally, what we can expect from non-U.S. equites.
Part One: Normalized Distribution – Ring a Bell (Curve)?
With the satirists, we agree that one thing we can count on in 2024 is taxes. As our 1099s are released, most of us are reminded of the year that was, and how the markets’ 2023 performance impacted our wealth. That review leads us to the question which has troubled mankind –or at least investors, for generations: “What should I expect to earn from my investment portfolio in the future?”
The answer is complicated yet simple; inherently wrong, but in its way dependable; and, therefore, something we can, in fact, count on. With some patience and pragmatism, we can at least arrive at a realistic outlook, if not a foolproof prediction. And, remember, we take this view while keeping an eye on limitations and risks.
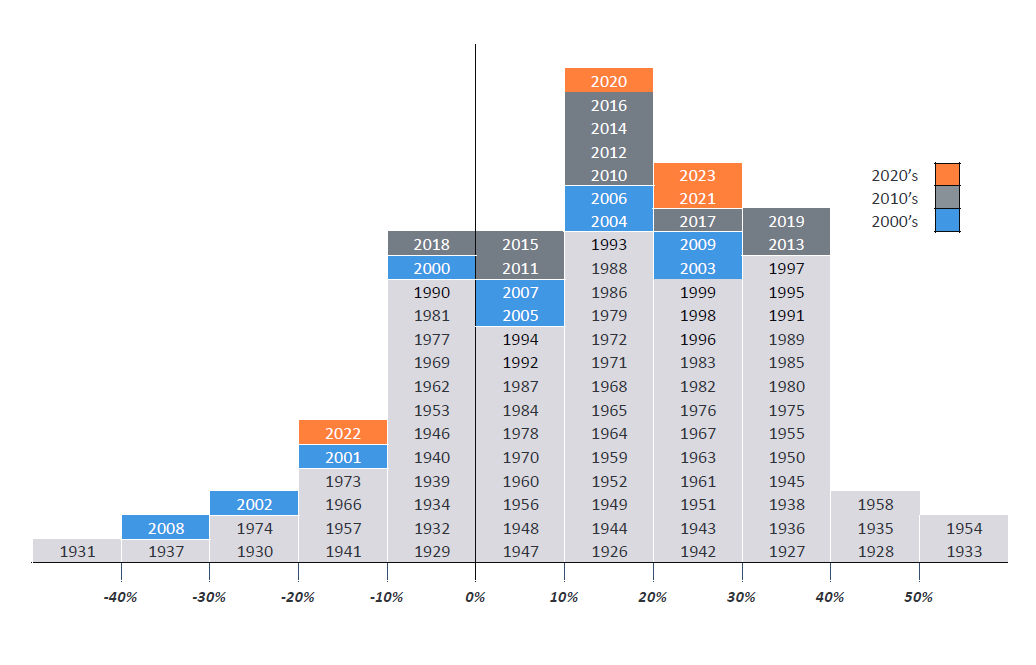
We start by asking whether we should expect equity returns in the future to be any different than the past. In the U.S. we have a history of stock returns dating back nearly a century. Statistically, that should be enough data to reliably infer that the forward returns won’t be meaningfully different than the past. But a peek at the distribution of annual returns reveals a few issues which should give investors pause, from a purely statistical point of view. Let’s take a closer look:
A Distribution of Historical Annual Returns
U.S. Equities 1926-2023

Source: Highland Consulting Associates
For starters, we don’t see the classic normal bell curve distribution. Rather, the annual return data shows a negative skew. A typical bell curve is symmetrical, but the bell curve created from this data shows a longer tail to the left relative to the right. This, then, is a negative skew, meaning good things happen most of the time (the right tail.) Bad things (on the left tail) are rare, but they can be more extreme when they hit. Asymmetry like this makes the average value as a predictive expectation less reliable.
Secondly, in looking at the left tail we note that the bottom decile of returns, i.e., the 10 worst years, feature four outcomes from 2001 onward, meaning fewer than 25% of the years account for 40% of the biggest losers. Even for good outcomes there are instances of clustering (see 1995-1999). Perhaps we can do better than looking to the past to project the future.
It’s About Time – Horizon, That Is
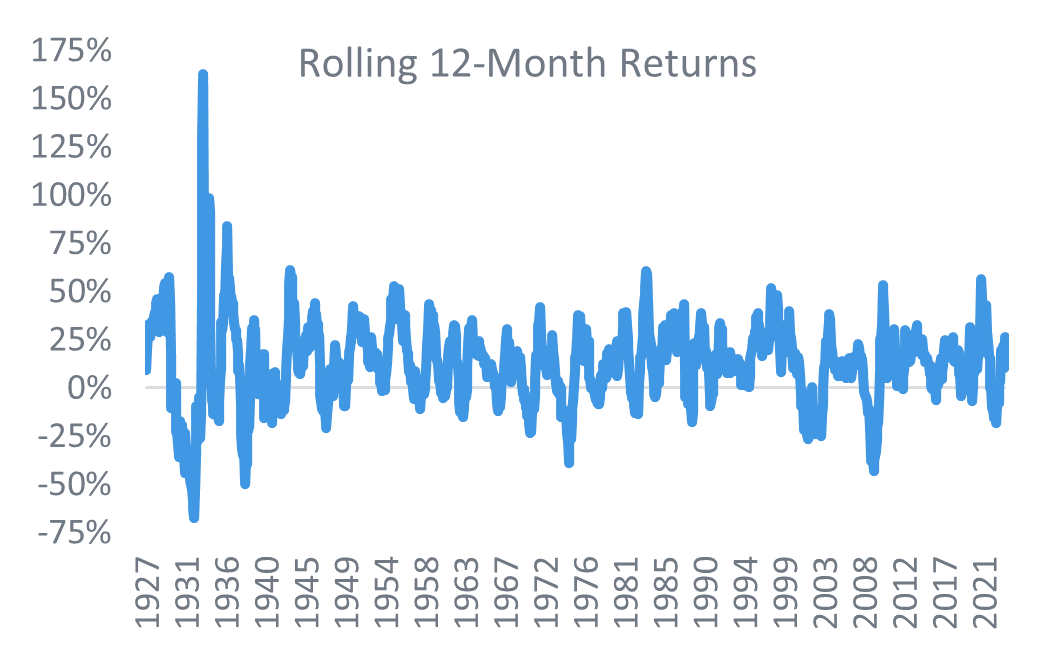
Before taking that look ahead, let’s deal with another essential forecasting factor: time horizon. Day-to-day, market performance is capricious and seemingly random. Weekly and monthly returns aren’t much of an improvement. Even the next 12 months’ return can vary wildly, as we’ve been reminded (and not so gently) recently. This time last year, market analysts and economists were all but certain that the U.S. economy would enter a recession. Almost unanimously, they predicted the Fed to respond by cutting rates to shore up a falling market. Instead, GDP grew by 2.5%, there were no rate cuts, and stocks rallied.
Today the outlook for 2024 is: “See the outlook for 2023. Rinse and repeat.” Given this, forecasting a single year’s outcome would seem to be a fool’s errand, and that is typically the case, given the historical experience of 12-month returns shown in the figure below. (And please note, the chart below is actually smoothed).
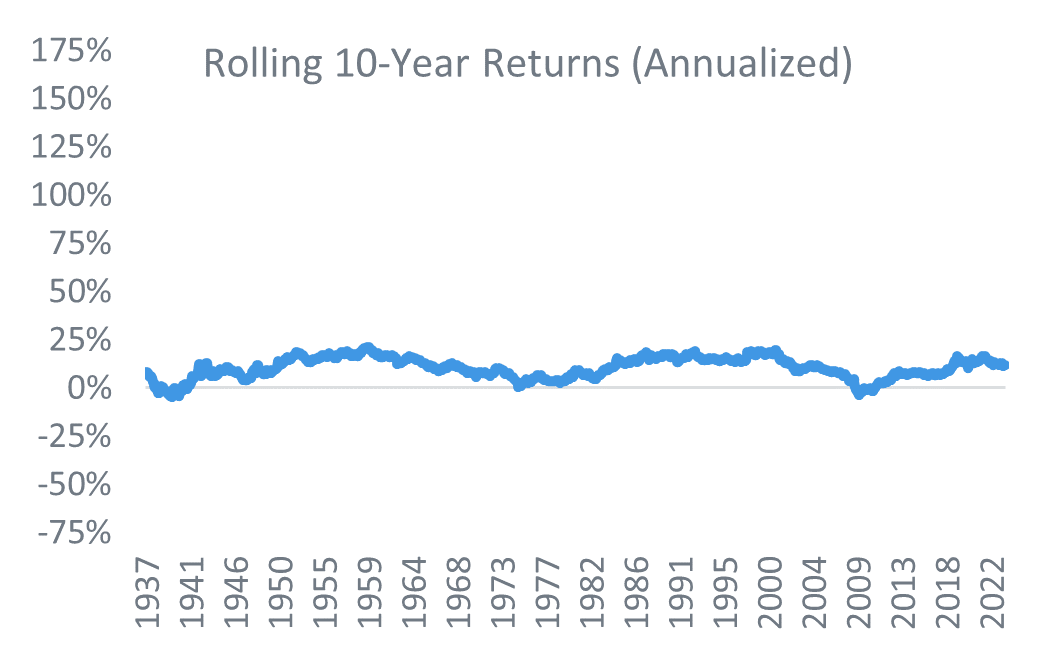
Fortunately, most institutional investors aren’t day traders. They set strategic goals on longer time horizons. The rolling 10-year experience shown on the same scale should give us more confidence in our projections if we’re willing to extend our timeframe. Foundations, endowments, pensions, and individuals saving for retirement generally absorb short-term volatility with greater equanimity if they keep their eyes on the long-term prize.
Returns Comparison: The Value of the Long View


Source: Highland Consulting Associates
What You Can Count On in 2024 – Equity Returns
It’s unlikely anyone can make a prediction on returns with complete accuracy. Your best guess will likely be wrong—but quite likely wrong in the right direction. (So don’t give up. Just lift your eyes to a longer-term target.)
Next up, we’ll consider what comprises the returns we count on. What contributes to a stock’s performance to generate a positive return? What is it that causes investors to trade our money with the expectation of getting a bigger piece of the wealth pie?
Highland Consulting Associates, Inc. was founded in 1993 with the conviction that companies and individuals could be better served with integrity, impartiality, and stewardship. Today, Highland is 100% owned by a team of owner-associates galvanized around this promise: As your Investor Advocates®, we are Client First. Every Opportunity. Every Interaction.
Highland Consulting Associates, Inc. is a registered investment adviser. Information presented is for educational purposes only and is not intended to make an offer of solicitation for the sale or purchase of specific securities, investments, or investment strategies. Investments involve risk and unless otherwise stated, are not guaranteed. Be sure to first consult with a qualified financial adviser and/or tax professional before implementing any strategy discussed herein. Past performance is not indicative of future performance.


