Forecasting Equity Returns – What Can I Count On in 2024? Part Two: What are the Pieces of the Pie? (And Is Your Pie Getting Smaller?)

Photo credit: Pixabay
A three-part conversation with Highland Consulting Associates.
In the next several weeks we’ll consider what you can expect from investment returns in 2024—or, rather, whether you can count on 2024 predictions at all. We’ll break this series into three parts to cover the major areas of investment opportunities beginning with historical returns, followed by components of market returns, and finally, what we can expect from non-U.S. equites.
Part Two: What are the Pieces of the Pie? (And Is Your Pie Getting Smaller?)
The Composition of Equities Returns.
Having considered what we can expect from our investment returns in 2024, let’s turn to a thought exercise. The market has returned just over 10% annualized since 1926, but we’ve already determined in our last discussion that we can’t just rely on history to repeat itself. But we can drill into that 10% return and attempt to decompose it into smaller pieces. How far can we go? Or more importantly, how far do we need to go? What are the parts of the pie we call investment returns?
Component #1: Inflation
Investors have become quite familiar with inflation recently, undoubtably more than most would care to be. But inflation is the baseline for the return generated by equities; investors expect to earn “inflation plus” from their stocks, that is, a real return.
After a prolonged bout of below-target inflation, the consequences of the pandemic and the aftermath of various COVID-19 relief programs played a part in generating the highest inflation the U.S. has seen in 50 years. As we emerge from that experience and look forward, fortunately, there is an active market “trading” future inflation. Inflation-linked treasuries trade at yields which intuit market expectations for inflation at various maturities. The 10-year breakeven inflation rate has remained rangebound throughout the recent high inflation environment.
Are you smarter than the market? Then there is money to be made trading TIPS (treasury inflation-protected securities)! As for me, I’ll concede that having little confidence in my outwitting the market on the effective rate of inflation for the next decade, and default to their projection, which is around 2.25% as of year-end 2023. During the last century inflation has run a little hotter, at closer to 3%, so our all-in return expectation should be trimmed relative to history, but cheer up – that’s not even real return you’re giving up!
Component #2: Income
Equity valuation is merely a variation of a discounted cashflow calculation. Companies earn profits, distribute a portion to shareholders, and retain a portion to fund future earnings growth. Some companies are heavier on the dividend distribution, and others plow as much as possible back into operations. When investing in a diversified portfolio of stocks, dividend payments are a certainty. The income provided by these payouts are a component of return.
Of the long-term 10% investors have earned, dividends have accounted for a large chunk of the total, at just over 4%. Unfortunately for investors today, dividend yields are less than half of what’s been realized in the past. Over the last 12, 24, and 60 months, the dividend yield on the S&P 500 has rarely topped 2% and has averaged around 1.6% to 1.7%. So right off the top it makes sense to take a 2% to 2.5% haircut from that historical 10% return.
Component #3: Growth
The current economy certainly seems to favor companies that retain a higher percentage of earnings to push earnings growth. High-flying tech stocks that drive index returns and capture investor interest tend to pay little to shareholders, and at this point who would want to own a boring utilities stock paying a fat dividend? Do they even know what AI is? I’m being facetious, but there’s no denying that today’s lower dividend yield is driven, in part, by investor preferences.
We encounter a few difficulties with projecting growth. First, real earnings growth is more volatile year-over-year than stock returns (12-month real earnings growth in 2009 dropped to -88%. In 2010 it was 743%). We can’t default to real GDP growth, which is more stable by comparison, because corporate earnings don’t capture all of the growth in the economy. If we’re looking for a stable economic data point that has historically aligned with growth in real earnings, real GDP growth per capita may do the trick.
GDP Growth Per Capita as a Proxy for Real Earnings Growth
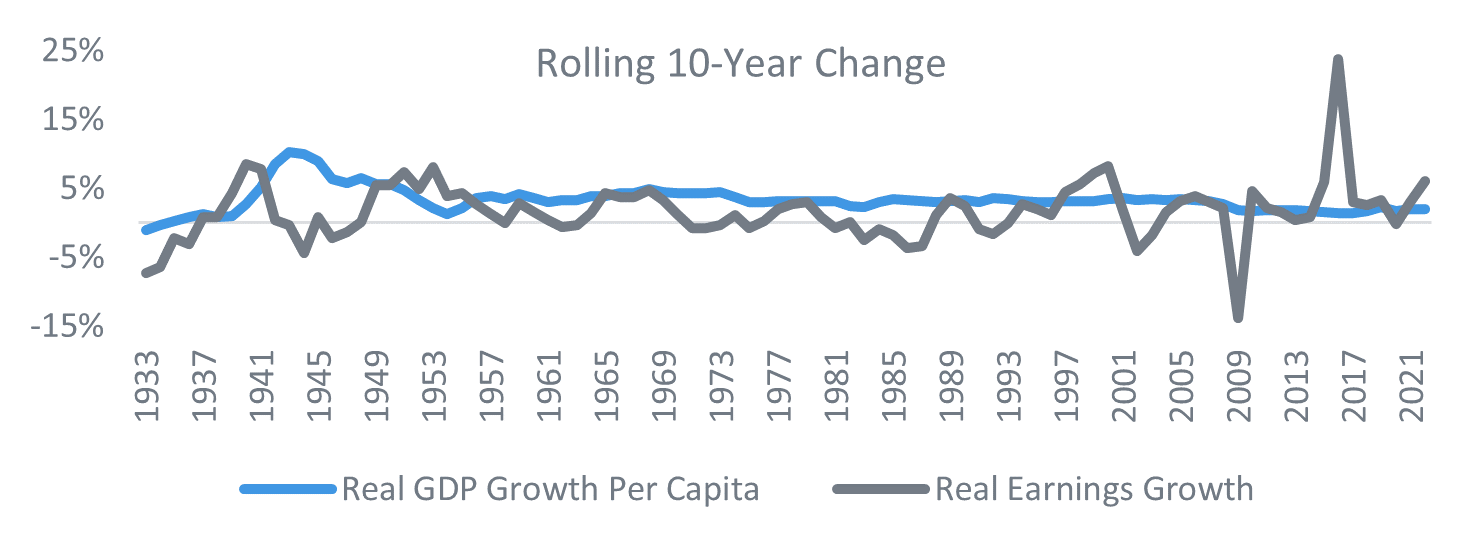
Source: Highland Consulting Associates, Inc.
This is admittedly a somewhat crude heuristic, but it does make the point that across long time horizons both measures tend to end up in the same place, and real GDP per capita does so with less than half of the volatility of earnings. Real earnings growth has added about 2.5% to long-term U.S. equity returns, while real GDP per capita has averaged closer to 2% in recent years. Again, we see some slippage when taking that past number and projecting it into the future.
Component #4: Valuations
If you’ve been adding along the way, we haven’t quite hit our 10%+ historical return with the first three components. The remainder can be attributed to an increase in valuations. Valuations present a challenge when looking to the future. Earnings multiples move with investor sentiment and tend to push hot markets higher and drag sinking stock prices further down the valley. Current valuations are above long-term averages in the U.S. by most metrics. So, should we expect them to decline? To revert to the mean?
Historical evidence seems to indicate that valuations may go through supercycles, with the tendency to vary extensively or settle into ranges, with possible regime change features. Is it even worthwhile to bother modeling valuation changes for the coming decade given these limitations? Put another way, would you look at the chart below and put a meaningful number on the long-term impact (positive or negative) of valuations? There appears no compelling reason to expect higher or lower valuations in the future. So we omit our last fraction of a percent.
Valuations as a Component of Returns – an Unreliable Predictor
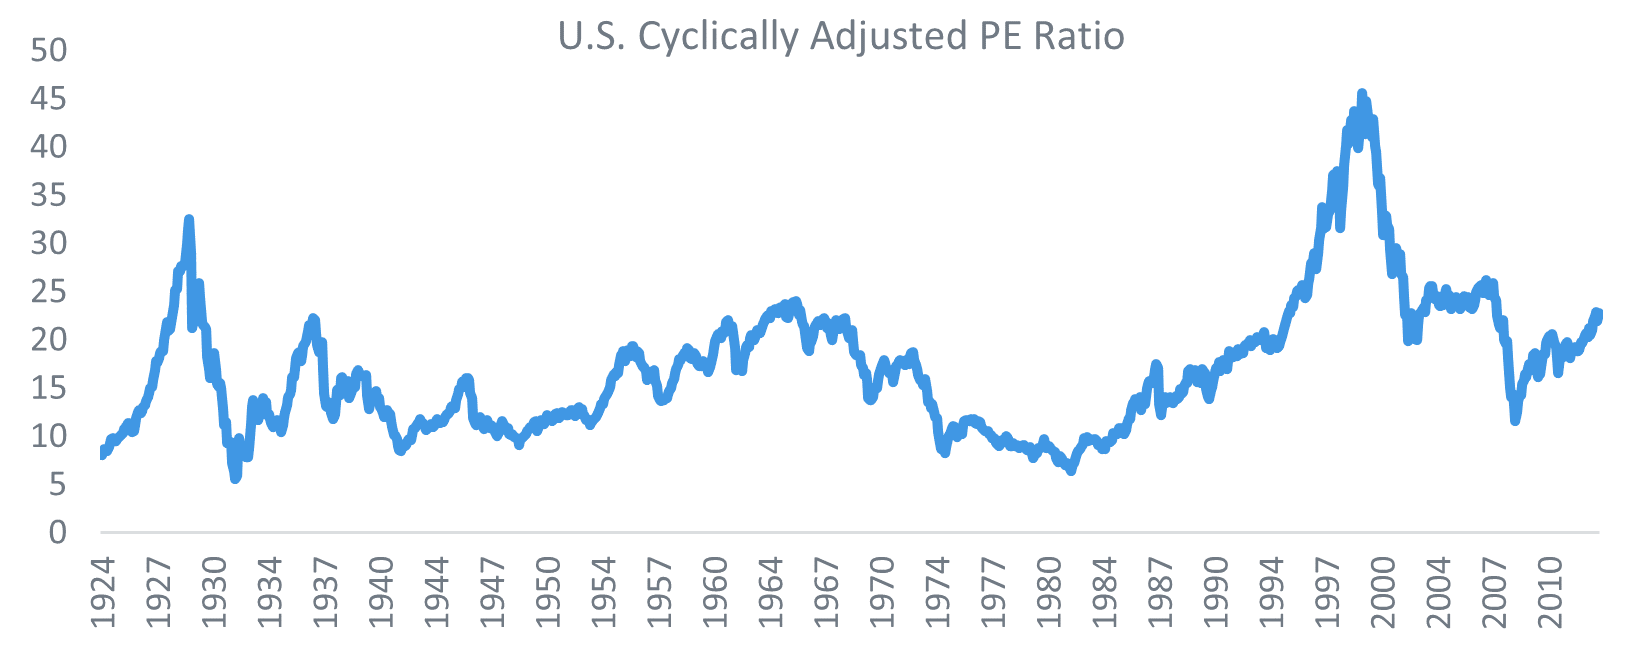
Source: Highland Consulting Associates, Inc.
So How Big is the Pie Now?
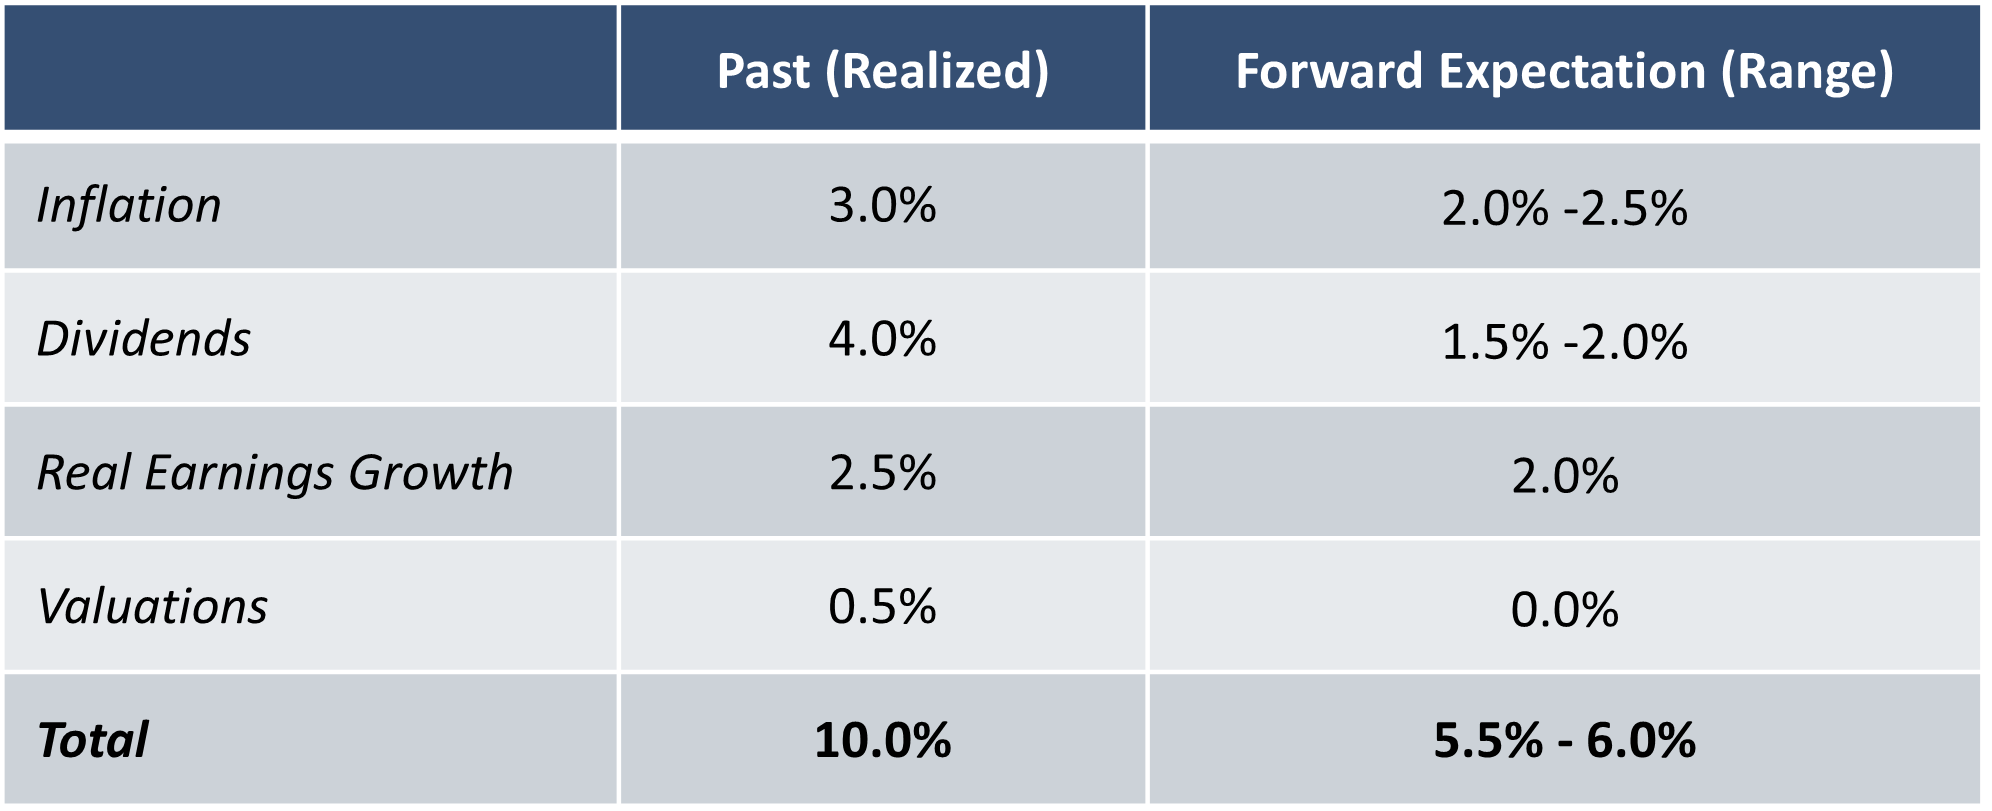
Now we look at the summary of our return decomposition and compare the past to our outlook for the future.
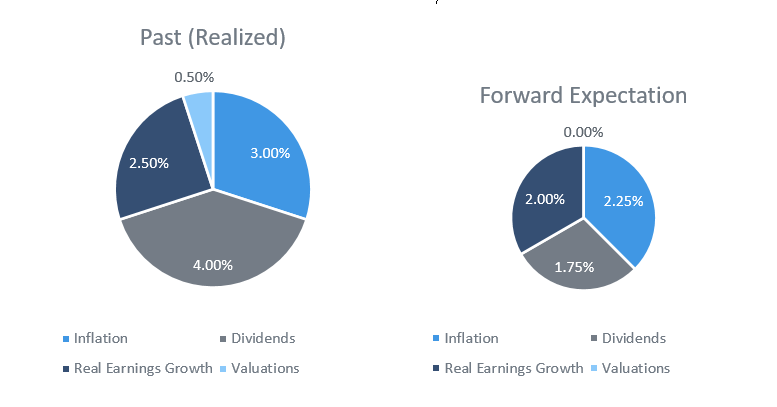
Or, to illustrate it another way, let’s look at the parts of the pie. The pie looks a little smaller for the near term. Time to tighten those belts.
Past Equities Returns vs. Forward Expectations
10% vs. 6% - The Pie Shrinks
Getting to that 100-year return bogey will require some help. Income is lower, inflation is lower, growth is lower, and there’s no valuation bump to account for. But we have a realistic idea of what to expect, which is definitely worth something (maybe not the missing 4%, but still). Each of these components has the ability to surprise to the upside (or the downside). As with anything in the investing world, the only thing we can say with certainty is that equities will not return exactly 6% over the next 10 years. But when December 31, 2033 rolls around, at the very least, we’ll have the data to know why we were wrong.
Stay tuned for Part Three of this conversation which will focus on small caps, global funds and emerging markets.
Highland Consulting Associates, Inc. was founded in 1993 with the conviction that companies and individuals could be better served with integrity, impartiality, and stewardship. Today, Highland is 100% owned by a team of owner-associates galvanized around this promise: As your Investor Advocates®, we are Client First. Every Opportunity. Every Interaction.
Highland Consulting Associates, Inc. is a registered investment adviser. Information presented is for educational purposes only and is not intended to make an offer of solicitation for the sale or purchase of specific securities, investments, or investment strategies. Investments involve risk and unless otherwise stated, are not guaranteed. Be sure to first consult with a qualified financial adviser and/or tax professional before implementing any strategy discussed herein. Past performance is not indicative of future performance.